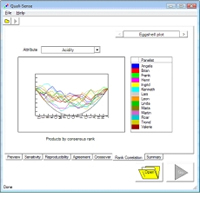
|                5 panelist performance tests 


                      - Assessor Sensitivity   
                      
                      
 - Assessor Reproducibility   
                      
                      
 - Assessor Agreement   
                      
                      
 - Assessor Crossover   
                      
                      
 - Eggshell Correlation 


                      Plots for direct data and result   visualization  
                      
                        - Spider Plot 
                        
 - Box plot 
                        
 - Spotty plot 
                        
 - Eggshell plot 
 
                      | 
                      | 
                   
                  
                     | 


              Color-coded result tables for easy interpretation  
              
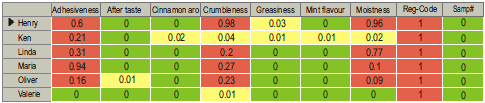
              Fig: Table of results (p-values) from   the reproducibility test 
              Auto Generated Summary Report 
            Data import/export from/to Microsoft Office Excel or ASCII   file formats (*.txt or *.csv), directly readable in The Unscrambler®.  |